Welcome to this single‑page research article template. It helps you publish clear, modern, and interactive technical writing with minimal setup.
Grounded in up to date good practices in web dev, it favors interactive explanations, clear notation, and inspectable examples over static snapshots.
Features
Introduction
The web offers what static PDFs can’t: interactive diagrams, progressive notation, and exploratory views that show how ideas behave. This template treats interactive artifacts—figures, math, code, and inspectable experiments—as first‑class alongside prose, helping readers build intuition instead of skimming results.
Who is this for
Ideal for anyone creating web‑native and interactive content with minimal setup:
- For scientists writing modern web‑native papers
- For educators building explorable lessons.
No web knowledge required—just write in Markdown.
This is not a CMS or a multi‑page blog—it’s a focused, single‑page, MDX‑first workflow.
Inspired by Distill
This project stands in the direct continuity of Distill (2016–2021). Our goal is to carry that spirit forward and push it even further: accessible scientific writing, high‑quality interactive explanations, and reproducible, production‑ready demos.
To give you a sense of what inspired this template, here is a short, curated list of well‑designed and often interactive works from Distill:
Getting Started
Installation
The recommended way is to duplicate this Space on Hugging Face rather than cloning it directly:
- Open the Space: 🤗 science-blog-template
and clickDuplicate this Space. - Give it a name, choose visibility, and keep the free CPU instance.
- Clone your new Space repository.
git clone git@hf.co:spaces/<your-username>/<your-space>
cd <your-space>
- Use Node.js 20 or newer.
To manage versions, consider using nvm
- macOS/Linux: see nvm-sh
- Windows: see nvm-windows
nvm install 20
nvm use 20
node -v
- Install lfs and pull files from the repository.
git lfs install
git lfs pull
- Install dependencies.
cd app
npm install
And that’s it!
You’re ready to go! 🎉
Development
npm run dev
Once started, the dev server is available at http://localhost:4321.
Build
npm run build
Deploy
Every push automatically triggers a build and deploy on Spaces.
# Make edits locally, then:
git add .
git commit -m "Update content"
git push
Serving the dist/ directory on any static host is enough to deliver the site.
A [slugified-title].pdf and thumb.jpg are also generated at build time.
You can find them in the public folder and point to them at [domain]/public/thumb.jpg.
Writing your content
Once you have set up your project and started the development server, you can start writing your article.
Content structure
Your article lives in one and unique place. The content folder.
Article.mdx
The article.mdx file is the main entry point of your article which contains 2 main parts.
Frontmatter
Metadata and options for the article. Each of them is described in the table below.
Frontmatter in app/src/content/article.mdx---
title: "This is the main title"
subtitle: "This will be displayed just below the banner"
description: "A modern, MDX-first research article template with math, citations, and interactive figures."
published: "Feb 19, 2025"
tags:
- research
- template
authors:
- name: "Thibaud Frere"
url: "https://huggingface.co/tfrere"
affiliations: [1]
- name: "Alice Martin"
url: "https://example.com/~alice"
affiliations: [1, 2]
- name: "Robert Brown"
url: "https://example.com/~bob"
affiliations: [2]
affiliations:
- name: "Hugging Face"
url: "https://huggingface.co"
- name: "Example University"
url: "https://example.edu"
doi: 10.1234/abcd.efgh
licence: Diagrams and text are licensed under <a href="https://creativecommons.org/licenses/by/4.0/" target="_blank" rel="noopener noreferrer">CC‑BY 4.0</a> with the source available on <a href="https://huggingface.co/spaces/stfrere/research-article-template">Hugging Face</a>, unless noted otherwise. Figures reused from other sources are excluded and marked in their captions (“Figure from …”).
seoThumbImage: "https://example.com/thumb.png"
tableOfContentsAutoCollapse: true
---
Frontmatter fields
| Field | Required | Notes | Type |
|---|---|---|---|
| title | Yes | Main title; supports line breaks with “\n” (falls back to “Untitled article”) | string |
| subtitle | Yes | Shown just below the title | string |
| description | Yes | Used for SEO/meta description | string |
| published | Yes | e.g., “2025-02-19” or readable date | string/date |
| tags | No | List of keywords | string[] |
| authors | No | Affiliation indices refer to the affiliations list | string[] or { name, url?, affiliations? }[] |
| affiliations | No | Alias: affiliation (single or array) | { name, url? }[] |
| doi | No | DOI identifier | string |
| licence | No | Rendered in footer; HTML supported | string (HTML allowed) |
| seoThumbImage | No | Overrides default OpenGraph image | string (URL) |
| tableOfContentsAutoCollapse | No | Controls TOC auto-collapse | boolean |
Content
Your story. Write your content here.
Content in app/src/content/article.mdximport placeholder from '../assets/image/placeholder.png'
import ResponsiveImage from '../components/ResponsiveImage.astro'
import Sidenote from '../components/Sidenote.astro'
<Sidenote>
This paragraph is written in Markdown.
<Fragment slot="aside">A short callout inserted via a component.</Fragment>
</Sidenote>
<ResponsiveImage src={placeholder} alt="Sample image with optimization" />
This paragraph is also written in Markdown.
Chapters
If your article becomes too long for one file, you can organize it into separate chapters.
Simply create a new file in the app/src/content/chapters directory.
Then, include your new chapter in the main article.mdx like below.
import MyChapter from './chapters/my-chapter.mdx';

<MyChapter />
Table of contents
The Table of contents is generated automatically from your H2–H4 headings. Keep headings short and descriptive; links work on desktop and mobile.
tableOfContentsAutoCollapse parameter in the frontmatter. Which is true by default. Theme
All interactive elements (buttons, inputs, cards, etc.) are themed with the primary color you choose.
You can update this main color to match your brand by changing the --primary-color variable in the app/src/styles/_variables.css file.
Use the color picker below to see how the primary color affects the theme.
Brand color
Color palettes
Here is a suggestion of color palettes for your data visualizations that align with your brand identity. These palettes are generated from your --primary-color.
Use color with care. Color should rarely be the only channel of meaning. Always pair it with text, icons, shape or position. The simulation helps you spot palettes and states that become indistinguishable for people with color‑vision deficiencies.
Using the palettes
You can copy them manually from the palette viewer just above, or fetch colors via window.ColorPalettes.getColors(key, count) where key is one of 'categorical', 'sequential', 'diverging', and count is the desired number of colors (defaults to 6).
Code example
// Usage (with explicit counts)
const cat = window.ColorPalettes.getColors('categorical', 8);
const seq = window.ColorPalettes.getColors('sequential', 8);
const div = window.ColorPalettes.getColors('diverging', 7);

// For current primary color string
const primaryHex = window.ColorPalettes.getPrimary();

// If you change --primary-color dynamically, call refresh to notify listeners
document.documentElement.style.setProperty('--primary-color', '#6D4AFF');
window.ColorPalettes.refresh();
Markdown
All the following markdown features are available natively in the article.mdx file. See also the complete Markdown documentation.
Math
KaTeX is used for math rendering. You can use inline notation $...$ or block $$...$$ notation. As an example, this is an inline math equation: and this is a block:
Code example
$x^2 + y^2 = z^2$

$$
\mathrm{Attention}(Q,K,V)=\mathrm{softmax}\!\left(\frac{QK^\top}{\sqrt{d_k}}\right) V
$$
Code
Use inline code with backticks `…` or ``` fenced code blocks ``` with a language for syntax highlighting (e.g., `python`).
As an example, here is inline code: greet("Astro") and below is a block.
def greet(name: str) -> None:
    print(f"Hello, {name}!")
Code example
`greet("Astro")`

```python
def greet(name: str) -> None:
    print(f"Hello, {name}!")
```
Code output
If you want to display the output of a code block, you can use the :::output directive. If it’s directly below the code block, it will adapt to the code block’s styling.
def greet(name: str) -> None:
    print(f"Hello, {name}!")

greet("Astro")
Hello, Astro!
Or it can also be used at a standalone block.
Hello i’m a standalone output block.
It also works in an accordion
print("This script prints a very very long line to check overflow behavior.")
This script prints a very very long line to check overflow behavior.
Code example
```python
def greet(name: str) -> None:
    print(f"Hello, {name}!")

greet("Astro")
```
:::output
Hello, Astro!
:::

Or you can also use it at a standalone block.

:::output
Hello i'm a standalone outputs block.
:::
Citation
The citation keys come from app/src/content/bibliography.bib.
Citation use the @ syntax (e.g., [@vaswani2017attention] or @vaswani2017attention in narrative form) and are automatically collected to render the bibliography at the end of the article.
-
In-text citation with brackets: (Vaswani et al., 2017).
-
Narrative citation: As shown by Kingma & Ba (2015), stochastic optimization is widely used.
-
Multiple citations and a footnote together: see (He et al., 2016; McKinney, 2017) for related work.
-
All citations in one group: (Cover & Thomas, 2006; Doe, 2020; He et al., 2016; Kingma & Ba, 2015; McKinney, 2017; OpenAI, 2023; Pedregosa et al., 2024; Raffel et al., 2020; Silver et al., 2017; E. Smith et al., 2024; J. Smith et al., 2021; Vaswani et al., 2017).
Code example
1) In-text citation with brackets: [@vaswani2017attention].

2) Narrative citation: As shown by @kingma2015adam, stochastic optimization is widely used.

3) Multiple citations and a footnote together: see [@mckinney2017python; @he2016resnet] for related work.

4) All citations in one group: [@vaswani2017attention; @mckinney2017python; @he2016resnet; @silver2017mastering; @openai2023gpt4; @doe2020thesis; @cover2006entropy; @zenodo2021dataset; @sklearn2024; @smith2024privacy; @kingma2015adam; @raffel2020t5].
astro.config.mjs file. There are several styles available: apa, vancouver, harvard1, chicago, mla. Default is apa. Footnote
Footnote use an identifier like [^f1] and a definition anywhere in the document, e.g., [^f1]: Your explanation. They are numbered and listed automatically at the end of the article.
- Footnote attached to the sentence above1.
- Multi-paragraph footnote example2.
- Footnote containing a list3.
- Footnote with an inline code and an indented code block4.
Code example
1) Footnote attached to the sentence above[^f1].

2) Multi-paragraph footnote example[^f2].

2) Footnote containing a list[^f3].

3) Footnote with an inline code and an indented code block[^f4].

4) Footnote that includes citation inside[^f5].

[^f1]: Footnote attached to the sentence above.

[^f2]: Multi-paragraph footnote. First paragraph.

    Second paragraph with a link to [Astro](https://astro.build).

[^f3]: Footnote with a list:

    - First item
    - Second item

[^f4]: Footnote with code snippet:

        function add(a: number, b: number) {
          return a + b;
        }

    Result: `add(2, 3) === 5`.

[^f5]: Footnote containing citation [@vaswani2017attention] and [@kingma2015adam].
Reference
In research articles, you may have to make references to anything. They are basically html anchors. They can be used internally in the article or externally in other articles.
-
Title
Each title is automatically generated with a slugged version from the citation key. ( slugged title from the citation key ) like for example, the id#mermaid-diagramsis generated from theMermaid diagramstitle.
Example Mermaid diagrams -
Image and chart
You can make a link to an image or a chart by adding an ID on it.<HtmlEmbed id="neural-network-mnist-like"/>then you can link to it with a link like<a href="#neural-network-mnist-like">Fig 1</a>.
Example Chart 1 or Fig 1
Code example
  #### Mermaid diagrams
  [Mermaid diagrams](#mermaid-diagrams)

  <HtmlEmbed id="neural-network-mnist-like"/>
  [Chart 1](#neural-network-mnist-like)

  <ResponsiveImage id="placeholder-image" src="..."/>
  [Fig 1](#placeholder-image)
Mermaid diagram
Native mermaid diagrams are supported (use a ```mermaid``` code fence). You can use the live editor to create your diagram and copy the code to your article.
erDiagram
  DATASET ||--o{ SAMPLE : contains
  RUN }o--o{ SAMPLE : uses
  RUN ||--|| MODEL : trains
  RUN ||--o{ METRIC : logs

  DATASET {
    string id
    string name
  }

  SAMPLE {
    string id
    string uri
  }

  MODEL {
    string id
    string framework
  }

  RUN {
    string id
    date startedAt
  }

  METRIC {
    string name
    float value
  }
Code example
```mermaid
erDiagram
  DATASET ||--o{ SAMPLE : contains
  RUN }o--o{ SAMPLE : uses
  RUN ||--|| MODEL : trains
  RUN ||--o{ METRIC : logs

  DATASET {
    string id
    string name
  }

  SAMPLE {
    string id
    string uri
  }

  MODEL {
    string id
    string framework
  }

  RUN {
    string id
    date startedAt
  }

  METRIC {
    string name
    float value
  }
```
Separator
Use --- on its own line to insert a horizontal separator between sections. This is a standard Markdown “thematic break”. Don’t confuse it with the --- used at the very top of the file to delimit the frontmatter.
Code example
Intro paragraph.

---

Next section begins here.
Table
Use pipe tables like | Column | with header separator | --- |.
| Method | Score |
|---|---|
| A | 0.78 |
| B | 0.86 |
Code example
| Method | Score |
| --- | --- |
| A | 0.78 |
| B | 0.86 |
Audio
Embed audio using <audio controls src={...} />.
Code example
import audioDemo from './assets/audio/audio-example.wav'

<audio controls src={audioDemo}/>
Footnotes
-
Footnote attached to the sentence above.
back: 1, 2 -
Multi-paragraph footnote. First paragraph.
Second paragraph with a link to Astro.
-
Footnote with a list:
- First item
- Second item
-
Footnote with code snippet:
function add(a: number, b: number) {
  return a + b;
}
Result:
add(2, 3) === 5. -
Footnote containing citation (Vaswani et al., 2017) and (Kingma & Ba, 2015).
- Cover, T. M., & Thomas, J. A. (2006). Entropy, Relative Entropy, and Mutual Information. In Elements of Information Theory (2nd ed., pp. 13–55). Wiley.
- Doe, J. (2020). Learning Efficient Representations for Large-Scale Visual Recognition [Phdthesis, Massachusetts Institute of Technology]. 10.5555/mit-2020-xyz
- He, K., Zhang, X., Ren, S., & Sun, J. (2016). Deep Residual Learning for Image Recognition. Proceedings of the IEEE Conference on Computer Vision and Pattern Recognition (CVPR), 770–778. 10.1109/CVPR.2016.90 back: 1, 2
- Kingma, D. P., & Ba, J. (2015). Adam: A Method for Stochastic Optimization. International Conference on Learning Representations (ICLR). https://arxiv.org/abs/1412.6980 back: 1, 2, 3
- McKinney, W. (2017). Python for Data Analysis (2nd ed.). O’Reilly Media. back: 1, 2
- OpenAI. (2023). GPT-4 Technical Report (Techreport arXiv:2303.08774). OpenAI. https://arxiv.org/abs/2303.08774
- Pedregosa, F., Varoquaux, G., Gramfort, A., & others. (2024). scikit-learn: Machine Learning in Python (Version 1.4). Software. 10.5281/zenodo.592264
- Raffel, C., Shazeer, N., Roberts, A., Lee, K., Narang, S., & others. (2020). Exploring the Limits of Transfer Learning with a Unified Text-to-Text Transformer. arXiv preprint. 10.48550/arXiv.1910.10683
- Silver, D., Schrittwieser, J., Simonyan, K., Antonoglou, I., Huang, A., & others. (2017). Mastering the game of Go without human knowledge. Nature, 550(7676), 354–359. 10.1038/nature24270
- Smith, E., Zhang, W., Rossi, M., & Patel, N. (2024). Privacy-Preserving Training with Low-Precision Secure Aggregation. In A. Smith & B. Johnson (Eds.), Proceedings of the 41st International Conference on Machine Learning (Vol. 235, pp. 12345–12367). PMLR. https://proceedings.mlr.press/v235/
- Smith, J., Lee, A., & Kumar, R. (2021). ImageNet-21K Subset (Version 2.0). Dataset on Zenodo. 10.5281/zenodo.1234567
- Vaswani, A., Shazeer, N., Parmar, N., Uszkoreit, J., Jones, L., Gomez, A. N., Kaiser, Lukasz, & Polosukhin, I. (2017). Attention Is All You Need. Advances in Neural Information Processing Systems. back: 1, 2, 3
Components
All the following components are available in the article.mdx file. You can also create your own components by creating a new file in the /components folder.
You have to import them in the .mdx file you want to use them in.
ResponsiveImage
Responsive images automatically generate an optimized srcset and sizes so the browser downloads the most appropriate file for the current viewport and DPR. You can also request multiple output formats (e.g., AVIF, WebP, fallback PNG/JPEG) and control lazy loading/decoding for better performance.
Credit: RCA Indian Head Test Pattern
| Prop | Required | Description |
|---|---|---|
zoomable | No | Adds a zoomable lightbox (Medium-like). |
downloadable | No | Adds a download button to fetch the image file. |
loading="lazy" | No | Lazy loads the image. |
caption | No | Adds a caption and credit. |
id | No | Adds an id to the outer figure for deep-linking and cross-references. |
Code example
import ResponsiveImage from '../components/ResponsiveImage.astro'
import myImage from './assets/image/placeholder.jpg'

<ResponsiveImage src={myImage} alt="Responsive, optimized example image" />

<ResponsiveImage
  src={myImage}
  layout="fixed"
  zoomable
  downloadable
  loading="lazy"
  alt="Example with caption and credit"
  caption={'Optimized image with a descriptive caption. <span class="image-credit">Credit: Photo by <a href="https://example.com">Author</a></span>'}
/>
Placement
Use these helpers when you need to step outside the main content flow: Sidenotes for contextual side notes, Wide to extend beyond the main column, and Full-width for full-width, immersive sections.
Sidenotes
This paragraph presents a key idea concisely.
Code example
import Sidenote from '../components/Sidenote.astro'

<Sidenote>
  Main paragraph with the core idea.
  <Fragment slot="aside">Short side note.</Fragment>
</Sidenote>
Wide example
Code example
import Wide from '../components/Wide.astro'

<Wide>
  Your content here...
</Wide>
Full-width example
Code example
import FullWidth from '../components/FullWidth.astro'

<FullWidth>
  Your content here...
</FullWidth>
Accordion
Can be used like this <Accordion>some content</Accordion>. You can pass any children content.
What can this accordion hold?
Text, lists, images, code blocks, etc.
- Item one
- Item two
A table inside an accordion
| Prop | Required | Description |
|---|---|---|
src | Yes | Path to the embed file in the embeds folder. |
title | No | Short title displayed above the card. |
desc | No | Short description displayed below the card. Supports inline HTML (e.g., links). |
frameless | No | Removes the card background and border for seamless embeds. |
align | No | Aligns the title/description text. One of left (default), center, right. |
id | No | Adds an id to the outer figure for deep-linking and cross-references. |
Code example
import Accordion from '../components/Accordion.astro'

<Accordion title="Accordion title" open>
  <p>Free content with <strong>markdown</strong> and MDX components.</p>
</Accordion>

<Accordion title="A table inside an accordion">
  | Prop        | Required | Description
|-------------|----------|----------------------------------------------------------------------------------
| `src`       | Yes      | Path to the embed file in the `embeds` folder.
| `title`     | No       | Short title displayed above the card.
| `desc`      | No       | Short description displayed below the card. Supports inline HTML (e.g., links).
| `frameless` | No       | Removes the card background and border for seamless embeds.
| `align`     | No       | Aligns the title/description text. One of `left` (default), `center`, `right`.
| `id`        | No       | Adds an `id` to the outer figure for deep-linking and cross-references.
</Accordion>

<Accordion title="Code example">
```ts
function greet(name: string) {
  console.log(`Hello, ${name}`);
}

greet("Astro");
```
</Accordion>
Note
Small contextual callout for tips, caveats, or emphasis.
Use notes to surface context without breaking reading flow.
Operation completed successfully.
Be careful: this action cannot be undone.
Plain note without header. Useful for short clarifications.
| Prop | Required | Type | Description |
|---|---|---|---|
title | No | string | Short title displayed in header |
emoji | No | string | Emoji displayed before the title |
class | No | string | Extra classes for custom styling |
variant | No | ’info' | 'success' |
Code example
import Note from '../../components/Note.astro'

<Note title="Heads‑up" emoji="💡" variant="info">
  Use notes to surface context without breaking reading flow.
</Note>

<Note variant="success">
  Operation completed successfully.
</Note>

<Note variant="danger">
  Be careful: this action cannot be undone.
</Note>

<Note>
  Plain note without header. Useful for short clarifications.
</Note>
Iframes
You can embed external content in your article using iframes. For example, TrackIO, Gradio or even Github code embeds can be used this way.
Gradio embed exampleCode example
<iframe frameborder="0" scrolling="no" style="width:100%; height:292px;" allow="clipboard-write" src="https://emgithub.com/iframe.html?target=https%3A%2F%2Fgithub.com%2Fhuggingface%2Fpicotron%2Fblob%2F1004ae37b87887cde597c9060fb067faa060bafe%2Fsetup.py&style=default&type=code&showBorder=on&showLineNumbers=on"></iframe>
<iframe src="https://trackio-documentation.hf.space/?project=fake-training-750735&metrics=train_loss,train_accuracy&sidebar=hidden&lang=en" width="100%" height="600" frameborder="0"></iframe>
<iframe src="https://gradio-hello-world.hf.space" width="100%" height="380" frameborder="0"></iframe>
HtmlEmbed
The main purpose of the HtmlEmbed component is to embed a Plotly or D3.js chart in your article. Libraries are already imported in the template.
They exist in the app/src/content/embeds folder.
For researchers who want to stay in Python while targeting D3, the d3blocks library lets you create interactive D3 charts with only a few lines of code. In 2025, D3 often provides more flexibility and a more web‑native rendering than Plotly for custom visualizations.
Credit: Example
| Prop | Required | Description |
|---|---|---|
src | Yes | Path to the embed file in the embeds folder. |
title | No | Short title displayed above the card. |
desc | No | Short description displayed below the card. Supports inline HTML (e.g., links). |
frameless | No | Removes the card background and border for seamless embeds. |
align | No | Aligns the title/description text. One of left (default), center, right. |
id | No | Adds an id to the outer figure for deep-linking and cross-references. |
data | No | Path (string) or array of paths (string[]) to data file(s) consumed by the embed. |
config | No | Optional object for embed options (e.g., { defaultMetric: 'average_rank' }). |
Code example
import HtmlEmbed from '../components/HtmlEmbed.astro'

<HtmlEmbed src="d3-line.html" title="This is a chart title" desc="Some chart description <br/>Credit: <a href='https://example.com' target='_blank'>Example</a>" />

<HtmlEmbed
  src="d3-line.html"
  title="Comparison A vs B"
  data={[ 'formatting_filters.csv', 'relevance_filters.csv' ]}
  config={{ defaultMetric: 'average_rank' }}
/>
Data
If you need to link your HTML embeds to data files, there is an assets/data folder for this.
As long as your files are there, they will be served from the public/data folder.
You can fetch them with this address: [domain]/data/your-data.ext
Vibe coding charts
Prompt
This page explains how to use the directives to author D3 charts as self‑contained HTML fragments. Using claude code works better.
The goal is to make responsive, accessible, interactive and dark mode ready charts.
- Use this ref a a baseprompt:
app/src/content/embeds/vibe-code-d3-embeds-directives.md. - Opt: use an already existing chart as a starting point.
- Ask claude to code the chart. Here’s a typical prompt:
I want you to code a new d3 chart named `yourchart`.
I have one CSV file called `yourdata.csv` in the data folder.
The csv has the following columns: `x`, `y`, `z`.
I want you to code a d3 chart that visualizes the data.
- Once the chart created, iterate with littles adjustments to make it better.
- And that’s it! 🎉
Real‑world examples
They can be found in the app/src/content/embeds folder and you can also use them as a starting point or examples to vibe code with.
Credit: FineVision
Figure 4: Left: baseline matrix (row-normalized, sequential palette). Right: Δ (Improved − Baseline) in percentage points, using a diverging palette centered at 0 to highlight improvements vs degradations.
Credit: FineVision
Credits: Ultrascale playbook
Credit: FineVision
Credit: FineVision
Best Practices
Short sections
Break content into small, purpose‑driven sections. Each section should answer a single question or support one idea. This improves scanability, helps readers navigate with the TOC, and makes later edits safer.
Clear, minimal annotations
Favor concise captions and callouts that clarify what to look at and why it matters. In code, highlight just the lines that carry the idea; avoid verbose commentary. Precision beats volume.
Explain math notation
Introduce symbols and variables the first time they appear, and prefer well‑known identities over custom shorthand. When formulas carry the message, add one sentence of plain‑language interpretation right after.
For example, in linear regression with features , weights , and bias , the prediction is:
A common training objective is the mean squared error over samples:
Interpretation: the model fits a hyperplane that minimizes the average squared prediction error.
Use the right chart
Picking the right visualization depends on your goal (compare values, show distribution, part-to-whole, trends, relationships, etc.). The Visual Vocabulary poster below provides a concise mapping from analytical task to chart types.
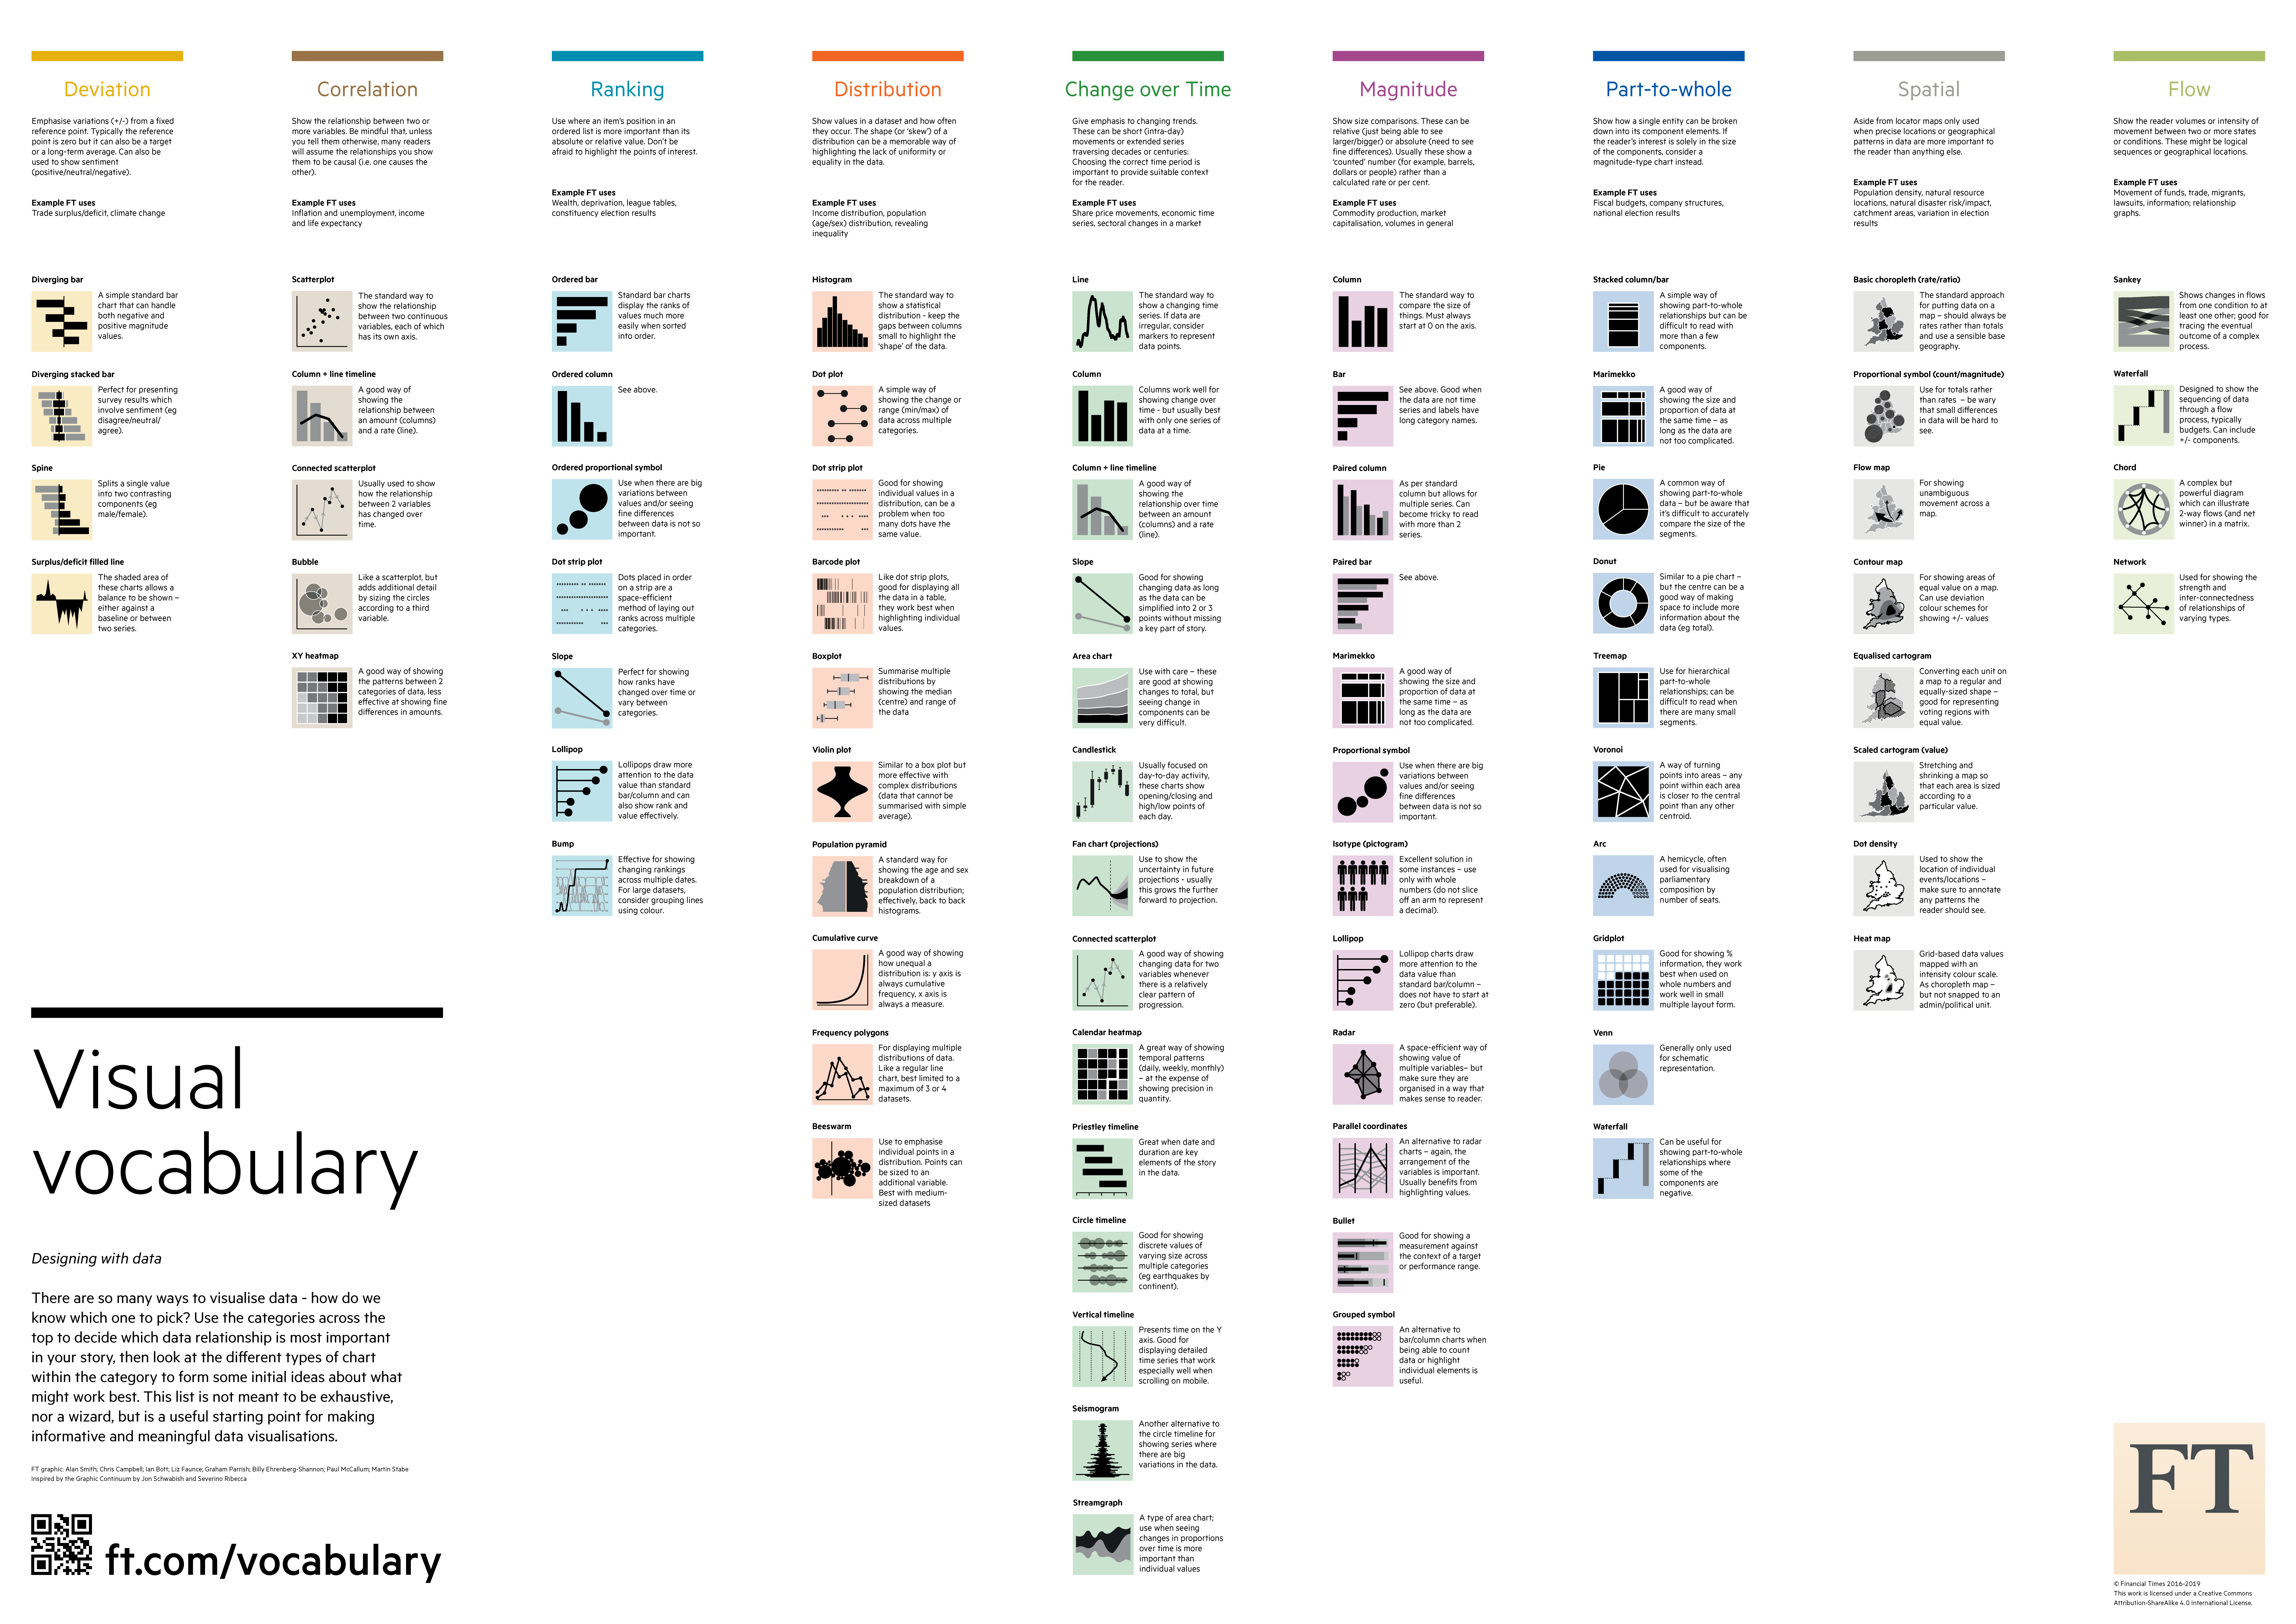
A handy reference to select chart types by purpose — click to enlarge.
Greetings
Huge thanks to the following people for their precious feedbacks!